Guide two: extracting your data
Before any writer tells a great story, they’ll research a topic inside and out before typing their first word. It’s the same with expert data visualisers. With purpose and care, they’ll extract the right data, in the right way, to make sure they can tell a great story with it.
Here’s how you do it.

Step 1: define the data you need
Don’t extract every field from every database from every business area…or you’ll drown in data.
Only extract:
- the fields you require
- the frequency of data you need
You need the Goldilocks amount of data — not too little, otherwise, you won’t be able to answer the business questions. But not too much, otherwise your dashboard will be slow and cumbersome. You need just the right amount of data. You can get this right by only extracting the data you need to answer your specific business use cases. For tips on how to do this, see our first guide.
Remember you can also source data from outside of your business including:
- free publicly available data
- data from your business partners, distributors or customers
- buying in third-party data

Step 2: collate and extract
This is a tricky thing to get right. You could be extracting data from numerous internal and external sources of all different types, sizes and complexity. You could have different levels of data quality in terms of completeness of data or consistency of data formats.
Generally, the more sources you’re looking to combine, the more effort and error tend to occur. So the trick is, again, to only focus on fulfilling the business requirements. Try to be lean with the data you extract. The more you prepare and spend time on step 1, the easier the extraction will be.

Step 3: give your data a health check
Without a doubt, once your data sets are together, you’ll find errors. So what you’ll need is a repeatable process to cleanse, enrich and combine data sources together. When we work with client data, we give it a full health-check, to make sure we’ve received what we thought we would. We’ll inspect fields, formats and completeness. We’ll then merge data sources, reformat fields and match data so it’s accurate and relevant.
We work in a structured way, taking our clients’ data through six assessments. We then calculate the health of their data and provide a KPI to show areas in need of focus.
- Data Completeness: We check data is complete and there are minimal missing cells
- Data Uniqueness: We make sure there aren’t duplicates
- Data Timeliness: We check data is not out-of-date
- Data Validity: We confirm data is in the correct format and within the expected range
- Data Accuracy: We check data is representative of reality
- Data Consistency: We ensure fields are the same in different databases
Worried you have data all over the place?
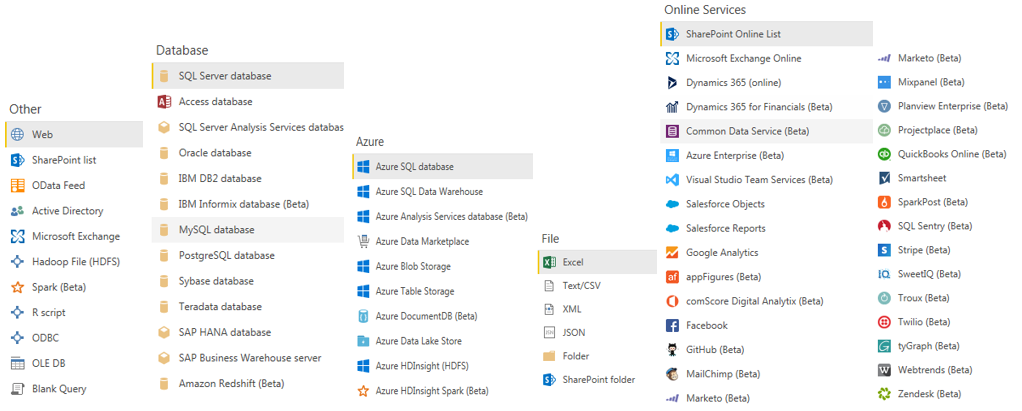
We’re used to working with data from multiple databases and applications. We wrangle with all file types and specialise in integrating data sources so insight can be drawn from a single place. Here’s a list of what we commonly work with:

Next time…we’ll share our guide for analysing data
Now you have your data, what do you do with it? Depending on your goals, you’ll want to analyse your data in different ways. We’ll share tips on how you can do this in our next guide.