 Skip to content
We speak to business leaders everyday about their data challenges and data opportunities. They’re all struggling with exactly the same thing – disconnected data that is siloed across their organisations, meaning that it’s really tricky to get answers to simple business questions like these…
How many customers do we have?
Well, what do you mean by ‘customer’? Do you mean the customers paying us today…or the ones who have paid in the past…or both or…eek.
Who are our most profitable clients?
Eeek…we’ll need to combine our financial data with our customer relationship management (CRM) system…this could take some time, sorry.
What’s our customer retention rate?
Eeek…if a customer has stopped paying us, have they gone? Or are they just dormant? How long are they dormant before we assume they’ve gone forever? What if they return? Eeek.
What’s our customer lifetime value?
LTV or RFV or CLV? So many acronyms, who knows where to start…? Is ‘value’ the fee they pay us monthly, annually or over all time? What costs do we take off…sales, marketing, customer service & more? This will take some thinking…
What’s the cost to acquire, service, engage, upsell and retain our customers?
Eeek…we’ll need to combine our financial data with our customer relationship management (CRM) system…this could take some time…have I said that before?!
Very quickly you can see that your disconnected data siloes are preventing you from answering the very basic of business questions. And surely all business leaders should have simple facts, like these, at their fingertips? If you can’t answer these simple questions quickly and easily, that’s a big problem for any business. So how do we fix this?

That’s right, at the very least every business will have a minimum of ten data sources – think about it, do you have any/all of these within your business?

That’s 10 already. And many businesses have two, three, five times this number, depending on the size and complexity of your business. Of course, you can’t look at every data source at once…so where do you start?
For most businesses, there are two things you focus on more than everything else – customers and cashflow. So it makes sense to prioritise your data in the same way.
Your financial data source will tell you:
- What money is coming in?
- Who has paid us, when and how?
- What money is going out?
- How much do things cost?
- How much profit are we making?
- What are the revenue/cost/profit trends over time?
- How does revenue/profit compare to last week/month/year?
- How much runway do we have?
- How much tax do we owe/pay?
- And so on…
Your customer data source will tell you:
- How many customers do we have?
- Who are our customers?
- How long has a customer been with us?
- What products & services do they buy?
- What deals are they considering?
- Are they a returning/frequent customer?
- Who are the contacts within the customer organisations?
- Have they attended our events, read our emails to sign up for our newsletters?
- Are our customers happy?
- And so on…
Whilst these data sources are valuable in their own rights, when you combine them together you can generate significantly more business insight such as:
- Who are our most profitable customers?
- Who are our least profitable customers?
- Are we focusing our time/investments on the right customers?
- What’s the cost of acquiring a customer? (CPA – cost per acquisition)
- What’s the average customer lifetime value (LTV)?
- Knowing our LTV and CPA…should we spend more/less to acquire customers in future?
- How many customers are active vs dormant (haven’t bought in X weeks/months)?
- What’s our retention rate?
- And so on…
As you can see, knowing the answers to these questions will fast-track your business insight and enable you to make smarter, faster data-driven decisions for your business. You’ll be able to make more informed decisions in areas of investment, sales, marketing, customer service, new product development, resourcing and more. All of these decisions should be data-driven, or data-informed at least – the days of making decisions using a gut feeling or based on whoever shouts the loudest should be over.

Most businesses will have a financial platform (eg Sage) and a CRM platform (eg Hubspot). There are many tools on the market, and you can use any tool you want. And, to connect your disconnected data, you don’t need to change the platforms you use – you can create a data layer that sits over the top.
Here’s a visualisation of the potential end goal for any business…
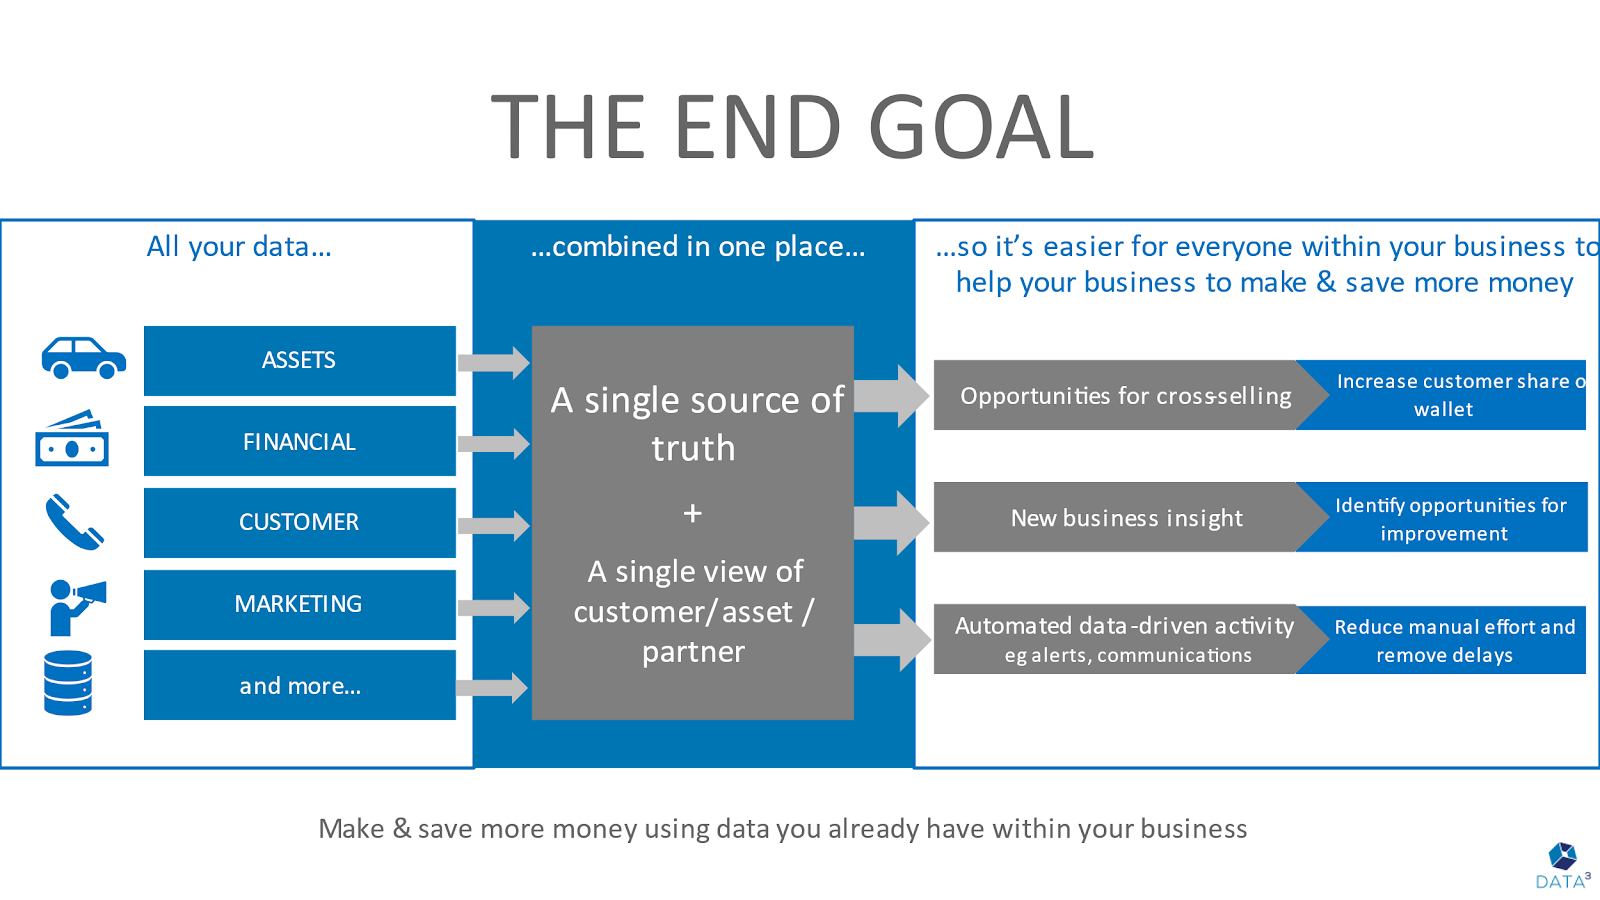
All your data, from all your data sources, can be combined in one place to create a single source of truth – this could be a database, a data lake or a data warehouse. Whatever language you use, and whatever solution you choose to build, the data layer needs to give you a single view of customer, asset, or any other aspect of your business. So that everyone in your business is able to do their jobs in a far easier way, and ultimately so they can help you to make & save more money. Like the sound of that? Sounds easy, doesn’t it? Well, it is…or it can be.
We want to make the process to combine your financial and customer data together really easy. Because that’s what we stand for – none of that data jargon, acronyms and techno-gabble. We make data simple. We make it manageable. We make it accessible. And we make it insightful.
So here’s five super practical steps you can take to get you started:
STEP 1 – DEFINE YOUR BUSINESS REQUIREMENTS
Make a list of all the business questions you want to answer or the business hypotheses you want to test/prove/disprove.
Consider the business answers/facts/figures you and your business need to know in order to make smarter, quicker business decisions.
Be bold. Be ambitious. And be super clear and specific. This isn’t the time to be vague and general.
STEP 2 – DEFINE YOUR DATA SOURCES AND THE DATA FIELDS YOU’LL NEED TO ACCESS
Defining your data sources will be a quick one – your financial platform and your CRM tool.
Defining the data fields you need can be tricky – the key here is to relate it to Step 1 – what data fields/tables do you need to extract/use/analyse in order to answer the specific business questions you want to answer?
For instance, you’ll want revenue/cost/profit from your financial platform but do you also need it split by day/week/month? And by product/service? And by customer name? And by sector? And so on…
STEP 3 – DECIDE WHAT TECHNOLOGY YOU WILL USE FOR YOUR DATA SOLUTION?
You will need to engage a technology expert within your organisation or work with a data consultancy/agency like us.
You need to consider how often data needs to be extracted – real-time, daily, weekly or similar?
You need to consider data security, data backups and who can access the data?
You need to consider how the technology will interface with the data sources and with any data visualisation/reporting/dashboard solutions you choose to use?
STEP 4 – SELECT A DATA VISUALISATION, REPORTING OR BUSINESS INTELLIGENCE (BI) TOOL
There are tons of them on the market and we’ve written a blog reviewing 18 of them.
When selecting a tool, make sure you think about who will create the visualisations and how skilled they are, who will view the visualisations and how/when, what security is required, and how much control and governance you need.
If in doubt, get some advice from a data consultancy/agency like us – you don’t want to choose the wrong tool for your business needs and waste time/effort in the wrong place.
STEP 5 – START WITH A PROOF-OF-CONCEPT (POC) OR A PROTOTYPE
Data projects can feel overwhelming, complex, and time-consuming. We’re big fans of starting with a time-boxed project to test the concept before jumping fully in.
A POC could be a project with a restricted scope like data for one region, or one product or for one business question, for instance.
You could set a fixed time period, to extract, analyse and visualise the data.
This can act as a fantastic way to win the hearts and minds of stakeholders before committing to a bigger project.
It’s been proven, time and again, that data-driven businesses make & save more money. Check out these facts from global studies – data-driven businesses:
- Are 162% more likely to exceed revenue targets – Forrester 2020
- Are 23 times more likely to acquire more customers – McKinsey 2020
- Grow at an average of 30% each year – Forrester 2020
- Increase their profit by 8% – BARC 2020

We always say that TODAY is the best day to start focusing on your data. Because the one truth for every business is your data is only getting larger. Because your business is collecting more and more data every second/hour/day. So your data is only getting larger, more complex, more siloed and more disconnected.
So, don’t delay… And start with combining your financial and customer data as that’s where you’ll see the biggest, quickest business wins.
Need some help getting started?
Data3 can help. Drop us a line at hello@data-cubed.co.uk or schedule a call now.